You run a clinical laboratory or manage hospital IT infrastructure. Someone - a pathologist, a microbiology director, a vendor rep - has told you that spectroscopy can identify bacteria in minutes instead of days, screen tissue samples without biopsy, or detect drugs of abuse from a drop of saliva. They are probably right. But the conversation quickly veered into wavelengths, wavenumbers, and Fourier transforms, and you need to make a procurement decision, not pass a physics exam.
This article is for you. No equations. No waveform diagrams. Just a clear explanation of what spectroscopy-based diagnostics actually do, how they fit into a clinical workflow, and what questions you should be asking before you commit budget.
What Spectroscopy Actually Does
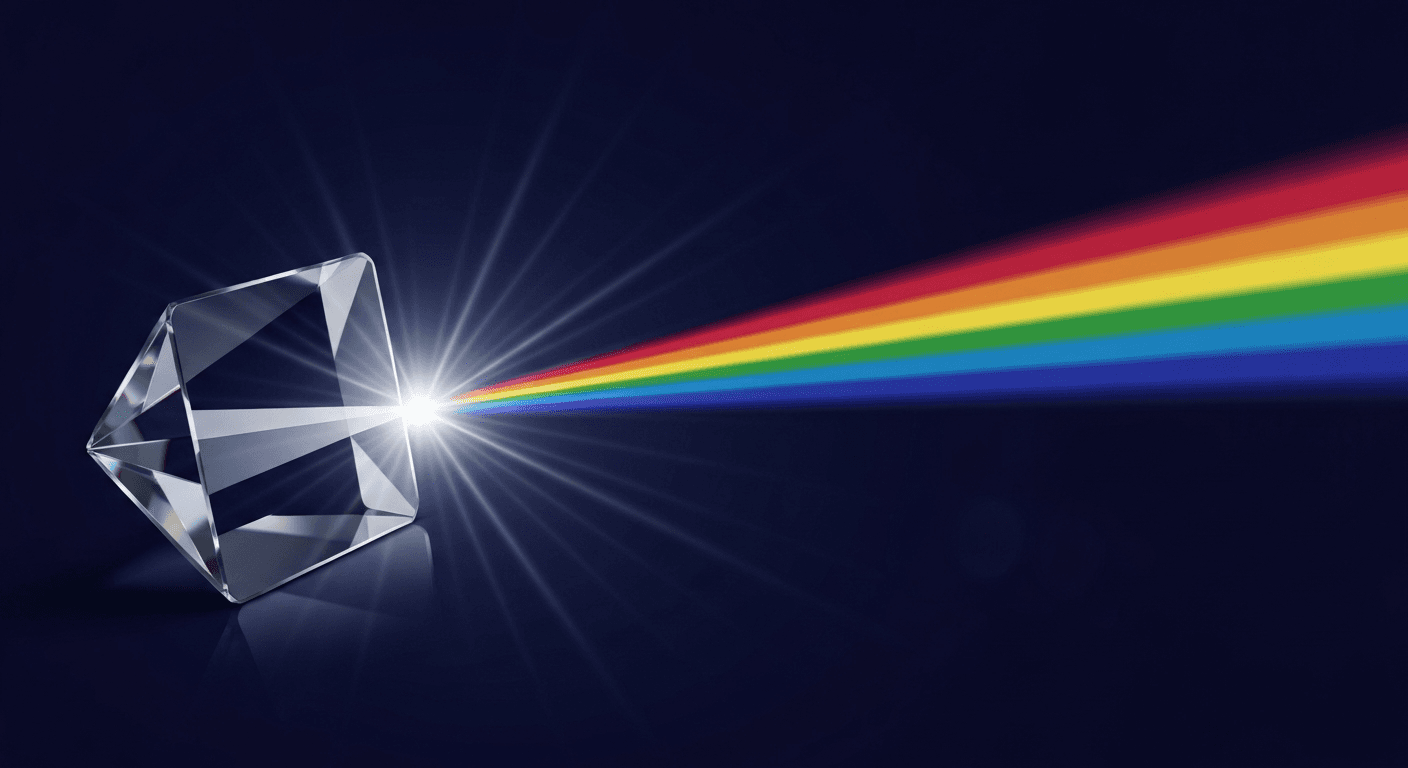
Every molecule absorbs, scatters, or emits light in a pattern that is unique to its chemical structure. Spectroscopy measures that pattern.
Think of it like this: if you shine white light through a glass of red wine, the wine absorbs certain colors and lets others through. The specific colors it absorbs tell you something about what is in the wine - the tannins, the alcohol, the pigments. A spectroscopy instrument does the same thing, but with far more precision, across wavelengths of light your eyes cannot see, and with the sensitivity to distinguish thousands of different molecules.
The output is a spectrum - a graph showing how much light the sample absorbed or scattered at each wavelength. That spectrum is effectively a molecular fingerprint. Feed it to a trained classification algorithm, and you get a diagnostic result: Staphylococcus aureus, or MRSA-positive, or glucose at 142 mg/dL.
The diagnostic value is straightforward: instead of growing a culture for 24-48 hours, or running a multi-step immunoassay, you place a sample on (or near) the instrument, acquire a spectrum in seconds to minutes, and get a classification result immediately.
The Three Modalities You Will Encounter
Three types of spectroscopy are making their way into clinical diagnostics. They measure different things, require different sample handling, and excel at different applications. Here is what each does, in plain language.
FTIR - The Molecular Fingerprint Scanner
What it measures: Infrared light absorption. Every chemical bond in a molecule vibrates at a characteristic frequency. FTIR (Fourier Transform Infrared) spectroscopy shines infrared light through or onto a sample and measures which frequencies get absorbed. The resulting spectrum shows which molecular bonds are present and in what quantities.
Analogy: Imagine pressing a tuning fork against different materials. Wood, metal, and plastic each dampen certain frequencies and let others ring through. FTIR does this with infrared light instead of sound, testing thousands of "frequencies" simultaneously.
How the sample is measured: Typically, a small amount of sample (a bacterial colony, a drop of fluid, a thin tissue section) is placed directly on a diamond crystal on the instrument surface. The light passes through the crystal, interacts with the sample at the surface, and bounces back to the detector. This is called ATR (Attenuated Total Reflectance) - you will see this term in vendor literature.
Where it excels clinically:
- Bacterial identification: The Bruker IR Biotyper (CE-IVD marked in Europe) identifies bacteria and yeast from colonies in under a minute - a complement or alternative to MALDI-TOF
- Tissue pathology: Research groups have demonstrated FTIR-based cancer screening in brain tissue, cervical cells, and blood serum
- Fluid analysis: Identification of unknown substances in toxicology, analysis of body fluids
Key characteristics for your evaluation:
- Acquisition time: 15-30 seconds per sample
- Sample preparation: sample must contact the crystal; crystal must be cleaned between measurements
- Instrument cost: $25,000-$80,000 for a benchtop unit
- Maturity: the most established of the three modalities in clinical settings
Raman - The Non-Contact Identifier
What it measures: When you shine a laser at a sample, most of the light bounces back unchanged. But a tiny fraction - about one in ten million photons - bounces back at a slightly different color. That color shift reveals the molecular structure of the sample. Raman spectroscopy measures these shifted photons.
Analogy: Imagine throwing tennis balls at a wall. Most bounce straight back. But occasionally, one hits a loose brick and comes back slightly slower or faster. By measuring the speed of the returning balls, you can map which bricks are loose - which is to say, you can map the molecular structure without touching the wall.
How the sample is measured: A laser (typically red or near-infrared, safe at the power levels used) is pointed at the sample. No contact required. The sample can be in a vial, behind glass, in a bag, or on a surface. The instrument collects the scattered light and analyzes it.
Where it excels clinically:
- Rapid drug identification: Handheld Raman devices can identify pills, powders, and liquids in seconds - invaluable for emergency departments and forensic toxicology
- Pathogen detection: SERS (Surface-Enhanced Raman Spectroscopy) can detect bacteria and viruses at very low concentrations
- Point-of-care diagnostics: The non-contact nature makes Raman attractive for bedside and field use
- Surgical guidance: Research is exploring real-time Raman scanning during surgery to identify tumor margins
Key characteristics for your evaluation:
- Acquisition time: 1-60 seconds depending on configuration
- Sample preparation: none in many cases (non-contact measurement)
- Instrument cost: $30,000-$150,000 for benchtop; handheld devices from $5,000
- Maturity: earlier in clinical adoption than FTIR, but advancing rapidly
NIR - The High-Throughput Screener
What it measures: Near-infrared light absorption, in a wavelength range between visible light and the mid-infrared that FTIR uses. NIR captures "overtone" vibrations - fainter echoes of the same molecular bonds FTIR measures. The spectra are broader and less detailed, but NIR compensates with speed, depth of penetration, and low cost.
Analogy: If FTIR is a high-resolution photograph of a fingerprint, NIR is a slightly blurry photograph. You cannot see every ridge and whorl, but you can still tell fingerprints apart - and you can take the photo much faster, from farther away, and with a cheaper camera.
How the sample is measured: NIR light passes through or reflects off the sample. Many NIR instruments can measure through packaging, through skin, or through containers. Some are chip-sized and can be embedded in wearable devices.
Where it excels clinically:
- Blood and tissue analysis: NIR penetrates tissue, enabling non-invasive measurements of hemoglobin, oxygenation, and (potentially) glucose
- Pharmaceutical quality control: already a regulatory-standard method for raw material identification in pharma manufacturing
- High-throughput screening: the fastest acquisition of the three modalities, ideal for triage workflows
- Wearable health monitoring: NIR sensors small enough for smartwatches and rings are in active development
Key characteristics for your evaluation:
- Acquisition time: 1-5 seconds
- Sample preparation: minimal to none
- Instrument cost: $15,000-$50,000 benchtop; miniaturized sensors under $5,000
- Maturity: very mature in pharma and food; clinical diagnostics applications are newer
Side-by-Side Comparison
| Factor | FTIR | Raman | NIR |
|---|---|---|---|
| Acquisition speed | 15-30 sec | 1-60 sec | 1-5 sec |
| Sample contact required | Yes (ATR crystal) | No | No |
| Works through water | Poorly | Well | Moderately |
| Spectral detail | Highest | High | Moderate |
| Instrument cost (benchtop) | $25K-$80K | $30K-$150K | $15K-$50K |
| Portable options | Limited | Yes (handheld) | Yes (chip-scale) |
| Best for | ID and fingerprinting | Non-contact analysis | Fast screening |
| Regulatory maturity (clinical) | CE-IVD devices exist | Pre-market | Pre-market |
For a deeper technical comparison of integration requirements and ML considerations, see our engineering-focused comparison of FTIR, Raman, and NIR.
What a Spectroscopy Diagnostic Workflow Actually Looks Like
This is the part that vendor brochures tend to skip. You know the instrument can generate a spectrum. But what does the end-to-end clinical workflow look like? Here is a realistic walkthrough.
Step 1: Patient and specimen identification
A clinician or lab technician enters the patient's medical record number (MRN) or scans a barcode on the specimen container. The workflow software links the incoming test to the patient record, the ordering physician, and the appropriate test protocol.
This step is identical to any other lab test. The difference is what happens next.
Step 2: Instrument preparation
For FTIR: the technician cleans the ATR crystal and runs a background measurement (30 seconds). This calibrates the instrument against environmental conditions. For Raman and NIR: minimal or no preparation - confirm the laser is ready, position the sample.
Step 3: Spectral acquisition
The technician places the sample (or positions the probe) and initiates the measurement through the workflow software. The instrument acquires one or more spectra. Total time: 5-60 seconds depending on the modality and protocol.
The key point: the operator does not interpret the spectrum. They do not need to understand spectroscopy. They press a button, wait for the acquisition to complete, and the software handles everything from there.
Step 4: Automated preprocessing and classification
The workflow software automatically preprocesses the raw spectrum (baseline correction, normalization, quality checks) and feeds it to a trained classification model. The model returns a result - an identification, a classification, a concentration - along with a confidence score.
- If the confidence score falls below a defined threshold, the software flags the result for manual review
- If the spectrum fails quality checks (insufficient signal, instrument malfunction, improper sample), the software prompts the operator to repeat the measurement
This entire step happens in under a second. The operator sees only the result.
Step 5: Result review and release
Depending on your lab's protocols and the test's regulatory classification, a pathologist or lab director may review and sign off on the result before release. The software presents the result with the confidence score and, optionally, a visualization of the spectrum for the reviewer.
Step 6: Result delivery to the EHR
The software generates a standards-compliant message - typically HL7v2 ORU^R01, the same message format your chemistry analyzers and hematology instruments use - and transmits it to your LIS or directly to the EHR. The result appears in the patient's chart, attributed to the ordering provider, with the appropriate LOINC code and CPT billing code.
From the EHR's perspective, a spectroscopy result looks like any other lab result. No special integration is required on the EHR side if the instrument workflow software speaks HL7.
Step 7: Billing
The test is logged as a billable event with the appropriate CPT code, payer information, and ordering provider. Volume reporting aggregates across instruments, sites, and time periods.
The total workflow time
For a single sample, from barcode scan to result in the EHR: 2-5 minutes, most of which is the physical handling (placing the sample, waiting for acquisition). The computational steps - preprocessing, classification, HL7 generation - take less than a second combined.
Compare this to culture-based bacterial identification (24-48 hours), MALDI-TOF (minutes, but requires colony growth first), or immunoassay panels (30-60 minutes). Spectroscopy's speed advantage is most dramatic when the alternative requires overnight culture.
For a deeper technical look at the software architecture behind this workflow, see our article on clinical workflow architecture for spectroscopy.
What to Evaluate When Considering Spectroscopy
If you are evaluating whether to bring spectroscopy-based diagnostics into your lab, here are the factors that matter - beyond the instrument itself.
Clinical validation
The most important question is not "does the instrument work" but "has the specific diagnostic test been validated for my clinical use case?" An FTIR spectrometer is a general-purpose analytical instrument. An FTIR-based strep A test is a specific clinical application that requires its own validation study, its own training data set, and (depending on intended use) its own regulatory clearance.
Ask whether the diagnostic test has been validated:
- In a clinical population similar to yours
- With the specific instrument model you would deploy
- With performance metrics (sensitivity, specificity, positive and negative predictive value) that meet your clinical needs
Regulatory status
As of mid-2026, the regulatory landscape for spectroscopy-based clinical diagnostics looks like this:
- CE-IVD (Europe): Bruker's IR Biotyper has CE-IVD marking for microbial identification by FTIR. Alifax's I-dOne has CE-IVD for FTIR-based bacterial ID. These are commercially available and clinically deployed in European labs.
- FDA-cleared (US): No spectroscopy-based point-of-care diagnostic device has received FDA 510(k) clearance or De Novo authorization as of this writing. Several are in development; the first submissions are expected in the near term.
- Laboratory Developed Tests (LDTs): In the US, laboratories with appropriate CLIA certification can develop and validate their own spectroscopy-based tests under the LDT pathway. This avoids FDA clearance but requires internal validation to CLIA standards.
The regulatory pathway significantly affects your timeline and risk. For a detailed analysis of the regulatory landscape, see our articles on SaMD classification for spectroscopy software and the FDA's evolving LDT framework.
Integration with existing systems
The spectrum and classification result are only useful if they reach the right systems. Key integration questions:
- LIS/LIMS connectivity: Does the instrument's workflow software generate HL7v2 messages that your LIS can receive? Or will you need a custom interface? Most instrument vendors provide their own acquisition software (Bruker OPUS, Thermo OMNIC), but these are scientific tools, not clinical workflow systems - they typically do not generate HL7 or connect to a LIS.
- EHR integration: Can results flow into your EHR (Epic, Cerner/Oracle Health, Meditech) via your existing LIS interface, or is a direct connection needed?
- Bidirectional communication: Can orders flow from the EHR to the instrument workflow? Bidirectional interfaces reduce manual entry and transcription errors.
- Billing system: Does the workflow software capture billable events in a format your billing system accepts?
See our deep dives on HL7v2 integration for spectroscopy and LIMS integration patterns for the technical details.
Throughput and staffing
Throughput depends on the modality, the sample preparation protocol, and the degree of automation:
- FTIR with manual ATR: An experienced technician can process 15-25 samples per hour, limited by the crystal cleaning step between samples
- Raman with automated stage: 20-40 samples per hour depending on exposure time
- NIR with autosampler: 60-120 samples per hour for high-throughput screening
Staffing considerations: spectroscopy instruments are generally simpler to operate than many existing lab instruments. The key training requirement is sample handling, not spectral interpretation (the software handles interpretation). Most labs report that a medical laboratory scientist can be trained to operate a spectroscopy diagnostic workflow in 2-4 hours.
Total cost of ownership
The instrument purchase price is the most visible cost but not the largest. Factor in:
| Cost component | Typical range | Notes |
|---|---|---|
| Instrument purchase | $15,000-$150,000 | Varies widely by modality and configuration |
| Clinical workflow software | $15,000-$25,000 setup + $3,000-$5,000/month | The layer between instrument and EHR |
| Validation study | $50,000-$200,000 | Internal clinical validation for your use case |
| LIS/EHR integration | $10,000-$50,000 | Depends on existing infrastructure |
| Staff training | $2,000-$5,000 | Initial training; ongoing competency assessment |
| Annual consumables | $500-$5,000 | Crystals, calibration standards, cleaning supplies |
| Annual maintenance | $3,000-$10,000 | Vendor service contract |
| Regulatory (if FDA path) | $300,000-$1,000,000+ | Only if pursuing FDA clearance as IVD |
The validation study and regulatory costs apply to the diagnostic test, not the instrument. If you are deploying a test that someone else has already validated and cleared (or if you are running an LDT), your costs are lower.
Data management and security
Spectral data files are small (50-500 KB per spectrum), but a high-volume lab generates significant data over time. Questions to address:
- Storage: Where are spectra and results stored? On the instrument PC, on a local server, in the cloud?
- Backup and retention: What is your retention policy for raw spectral data? Some regulatory frameworks require retaining raw data for years.
- PHI handling: If spectral data is linked to patient identifiers, it is protected health information (PHI) and must be handled in compliance with HIPAA
- Multi-site aggregation: If you operate multiple sites, how is spectral data centralized for analytics, model retraining, and compliance reporting?
Common Misconceptions
"Spectroscopy replaces our existing testing." In most near-term applications, spectroscopy complements existing methods. A spectroscopy result might serve as a rapid preliminary screen (results in minutes), with conventional testing (culture, PCR, immunoassay) used for confirmation when needed. Over time, as clinical validation data accumulates and regulatory clearances expand, spectroscopy may replace slower methods for specific indications.
"Our staff would need spectroscopy training." The staff needs training on the clinical workflow - the specimen handling, the software interface, the result review process. They do not need to understand spectroscopy itself. If your technicians can operate a chemistry analyzer, they can operate a spectroscopy diagnostic workflow.
"The instruments are too expensive for our volume." Depending on your clinical application, the economics can be compelling. A single FTIR instrument at $40,000 that identifies bacteria in 1 minute - versus sending samples out for culture at $30-$50 each with 24-48 hour turnaround - can pay for itself in reduced send-out costs and faster clinical decisions. Run the numbers for your specific volume and payer mix.
"AI-based diagnostics are a black box." Modern spectral classification models can be designed for interpretability. The software can show which spectral features drove the classification decision, linking the result back to specific molecular signatures. This is not a black box - it is pattern recognition grounded in physical chemistry. See our article on explainable AI for spectral classification.
"Spectroscopy diagnostics are not FDA-cleared, so we cannot use them." CLIA-certified laboratories in the US can develop and validate laboratory-developed tests (LDTs). The absence of an FDA-cleared device does not mean the technology cannot be used clinically - it means your lab takes on the validation responsibility. Many innovative diagnostic methods enter clinical use via the LDT pathway before an FDA-cleared commercial product exists.
Questions to Ask Your Vendor
Whether you are evaluating a spectroscopy instrument, a diagnostic test, or a clinical workflow software platform, use this checklist:
About the diagnostic test
- What clinical validation data exists? Published studies, sample sizes, sensitivity and specificity?
- Was the validation performed on a clinical population, or on reference samples?
- What is the intended use statement? What claims are being made?
- Is the test FDA-cleared, CE-IVD marked, or an LDT?
- What is the false positive and false negative rate in the validated population?
- What is the expected rate of "inconclusive" results that require repeat testing or alternative methods?
About the instrument
- What is the total acquisition time per sample, including any required preparation and calibration?
- What consumables are required, and what are the annual consumable costs?
- What are the environmental requirements (temperature, humidity, vibration)?
- What is the instrument's recommended calibration and maintenance schedule?
- What is the expected instrument lifetime and cost of a service contract?
About the software and integration
- Does the workflow software generate HL7v2 ORU messages? Which version (2.3, 2.5.1)?
- Can the software interface with our specific LIS (name it)?
- Does the software support patient/specimen barcode scanning?
- Is there an audit trail compliant with 21 CFR Part 11?
- Who hosts the software, and where is data stored?
- What happens if the network connection goes down - can the instrument still operate locally?
- Does the software support multi-site deployment and centralized reporting?
- How are software updates and model updates deployed?
- What is the cybersecurity posture? Has a security assessment been performed?
About operations
- How long does it take to train a medical laboratory scientist to run this workflow?
- What is the expected daily throughput for a single operator?
- What quality control protocols are required (daily QC, proficiency testing)?
- What happens when a result falls below the confidence threshold?
- Is there a proficiency testing program available?
About the business
- What is the total cost of ownership for the first year? For year three?
- What are the contract terms - implementation fee, monthly fee, per-test fee, minimum commitments?
- What is the regulatory status, and who bears the regulatory risk?
- Can you provide references from comparable lab environments?
Where to Go from Here
Spectroscopy-based diagnostics are crossing from research into clinical deployment. The instruments work. The AI classification models work. The gap is the clinical workflow layer - the software that connects the spectrometer to the patient record, the billing system, and the clinician's decision-making.
If you are evaluating spectroscopy for your lab, start with the clinical question: what diagnostic problem are you solving, and does spectroscopy offer a meaningful advantage over your current method in speed, accuracy, or cost? If the answer is yes, the technical integration is a solvable engineering problem.
For a detailed comparison of the three modalities from an engineering perspective, read FTIR vs. Raman vs. NIR for Point-of-Care Diagnostics. For the regulatory framework, see SaMD Classification for Spectroscopy Software. For what the software architecture looks like under the hood, see Clinical Workflow Architecture for Spectroscopy Instruments.
Part of the SpectraDx technical blog.